
Insights from Paper - Google Dapper: a Large-Scale Distributed Systems Tracing Infrastructure

Dapper is Google’s large-scale distributed systems tracing platform.
It began as a self-contained tracing tool but evolved into a monitoring platform. It has enabled the creation of many different tools, some of which were not even anticipated by its designers.
Modern applications are constructed from collections of software modules
developed in different programming languages and could span many
thousands of machines across multiple physical facilities. Dapper helps in understanding system behavior and reasoning about performance issues.
The main goal of this paper is to report on Google’s experience in building, deploying, and using the system for over two years.
Dapper’s primary measure of success has been its usefulness to developer and operations teams.
Let’s take the example of a web search. A front-end service may distribute a web query to many hundreds of query servers, each searching within its piece of the index. The query may also be sent to several other sub-systems that process advertisements, check spelling, or look for specialized results, including images, videos, news, etc. Results from all of these services are selectively combined in the results.
In total, thousands of machines and many different services might
be needed to process one universal search query.
An engineer looking only at the overall latency may know a problem but may need help guessing which service is at fault and why it behaves poorly.
The above example gives rise to two fundamental requirements for Dapper: ubiquitous deployment and continuous monitoring. Three concrete design goals came out from these requirements:
Low overhead: The tracing system should have a negligible performance impact on running services.
Application-level transparency: Programmers should not need to be aware of the tracing system.
Scalability: It needs to handle the size of Google’s service.
An additional design goal is for tracing data to be available for analysis quickly after it is generated: ideally within a minute.
For the team, the most challenging goal was application-level transparency. It was achieved by restricting Dapper’s core tracing instrumentation to a small corpus of ubiquitous threading, control flow, and RPC library code.
Summary of contributions
There are a lot of distributed systems tracing tools, but Dapper is most closely related to Pinpoint, Magpie, and X-Trace. Dapper’s implementation
contains several new contributions in this space.
For example, Dapper has found sampling necessary for low overhead, especially in highly optimized latency-sensitive web services.
Distributed Tracing in Dapper
A tracing infrastructure for distributed services needs to record information about all the work done in a system on behalf of a given initiator.

For example, the above diagram shows a service with 5 servers. When a user request arrives at the front end, it sends two RPCs to servers B and C. B can respond right away, but C requires work from backends D and E before it can reply to A, which in turn responds to the originating request.
A simple yet useful distributed trace for this request would be a collection
of message identifiers and timestamped events for every message sent and received at each server.
Two classes of solutions have been proposed to aggregate this information.
Black box: It assumes there is no additional information other than the message record, and uses statistical regression techniques to infer that association.
Annotation-based: It relies on applications or middleware to explicitly tag every record with a global identifier that links these message records to the originating request.
In Google’s environment, all applications use the same threading model, control flow, and RPC system. Annotation-based schema is selected.
The Dapper team thinks of a trace as a tree of nested RPCs.
The core data model is not restricted. It can trace SMTP sessions in Gmail, HTTP requests from the outside world, and outbound queries to SQL
servers.
The team modeled Dapper traces using trees, spans, and annotations.
Trace trees and spans
In a Dapper trace tree, the tree nodes are basic work units called spans. The edges indicate a causal relationship between a span and its parent span.
A span is also a simple log of timestamped records that encode the span’s start and end time, RPC timing data, and zero or more application-specific annotations.

The above diagram shows how spans form the structure of a larger trace.
Dapper records a human-readable span name for each span and a span id and parent id. Spans created without a parent id are known as root spans.
All spans associated with a specific trace also share a common trace id.
All of these ids are probabilistically unique 64-bit integers. Typically
there is a single span for each RPC. Each tier of infrastructure adds one
level of depth to the trace tree.
The diagram below shows a more detailed view of the logged events in a typical Dapper trace span.
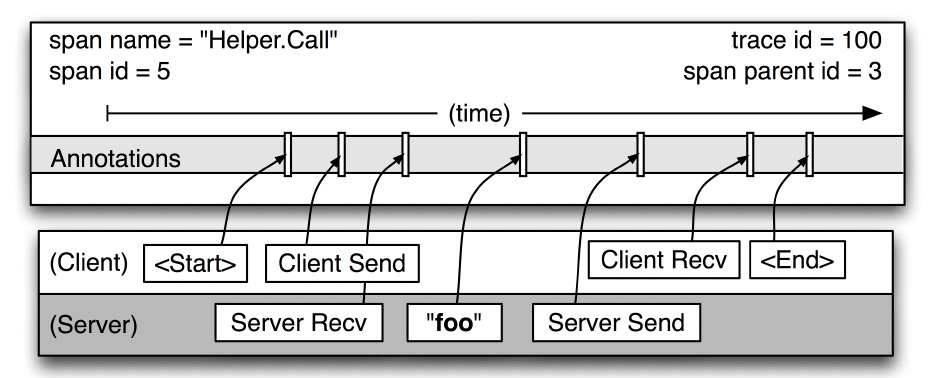
If application owners choose to augment the trace with their own annotations (like the “foo” annotation in the diagram), these are also recorded with the rest of the span data.
A span can contain information from multiple hosts. Every RPC span contains annotations from both the client and server processes.
Since the client and server timestamps come from different host machines, we must be mindful of clock skew.
Instrumentation points
Dapper can follow distributed control paths with near-zero intervention from application developers.
Dapper relies almost entirely on the instrumentation of a few common
libraries:
Dapper attaches a trace context to thread-local storage when a thread handles a traced control path.
When the computation is deferred or made asynchronous, developers use callbacks. Dapper ensures that all such callbacks store their creator's trace context, associated with the appropriate thread when the callback is invoked.
Most of Google’s inter-process communication is built around a single RPC framework with bindings in both C++ and Java. The dapper team has instrumented that framework to define spans around all RPCs.
Dapper trace data is language-independent, and many traces in production combine data from processes written in both C++ and Java.
Annotations
Dapper also allows application developers to enrich Dapper traces with additional information that may be useful to monitor higher-level system behavior or help debug problems.
Dapper allows users to define timestamped annotations through a simple API. The core of the API is listed below in both C++ and Java.
// C++:
const string& request = ...;
if (HitCache())
  TRACEPRINTF("cache hit for %s", request.c_str());
else
  TRACEPRINTF("cache miss for %s", request.c_str());

// Java:
Tracer t = Tracer.getCurrentTracer();
String request = ...;
if (hitCache())
  t.record("cache hit for " + request);
else
  t.record("cache miss for " + request);
Annotations can have arbitrary content. In addition to simple textual annotations, Dapper also supports a map of key-value annotations.
Trace collection
The Dapper trace logging and collection pipeline is a three-stage process, as shown in the diagram below:
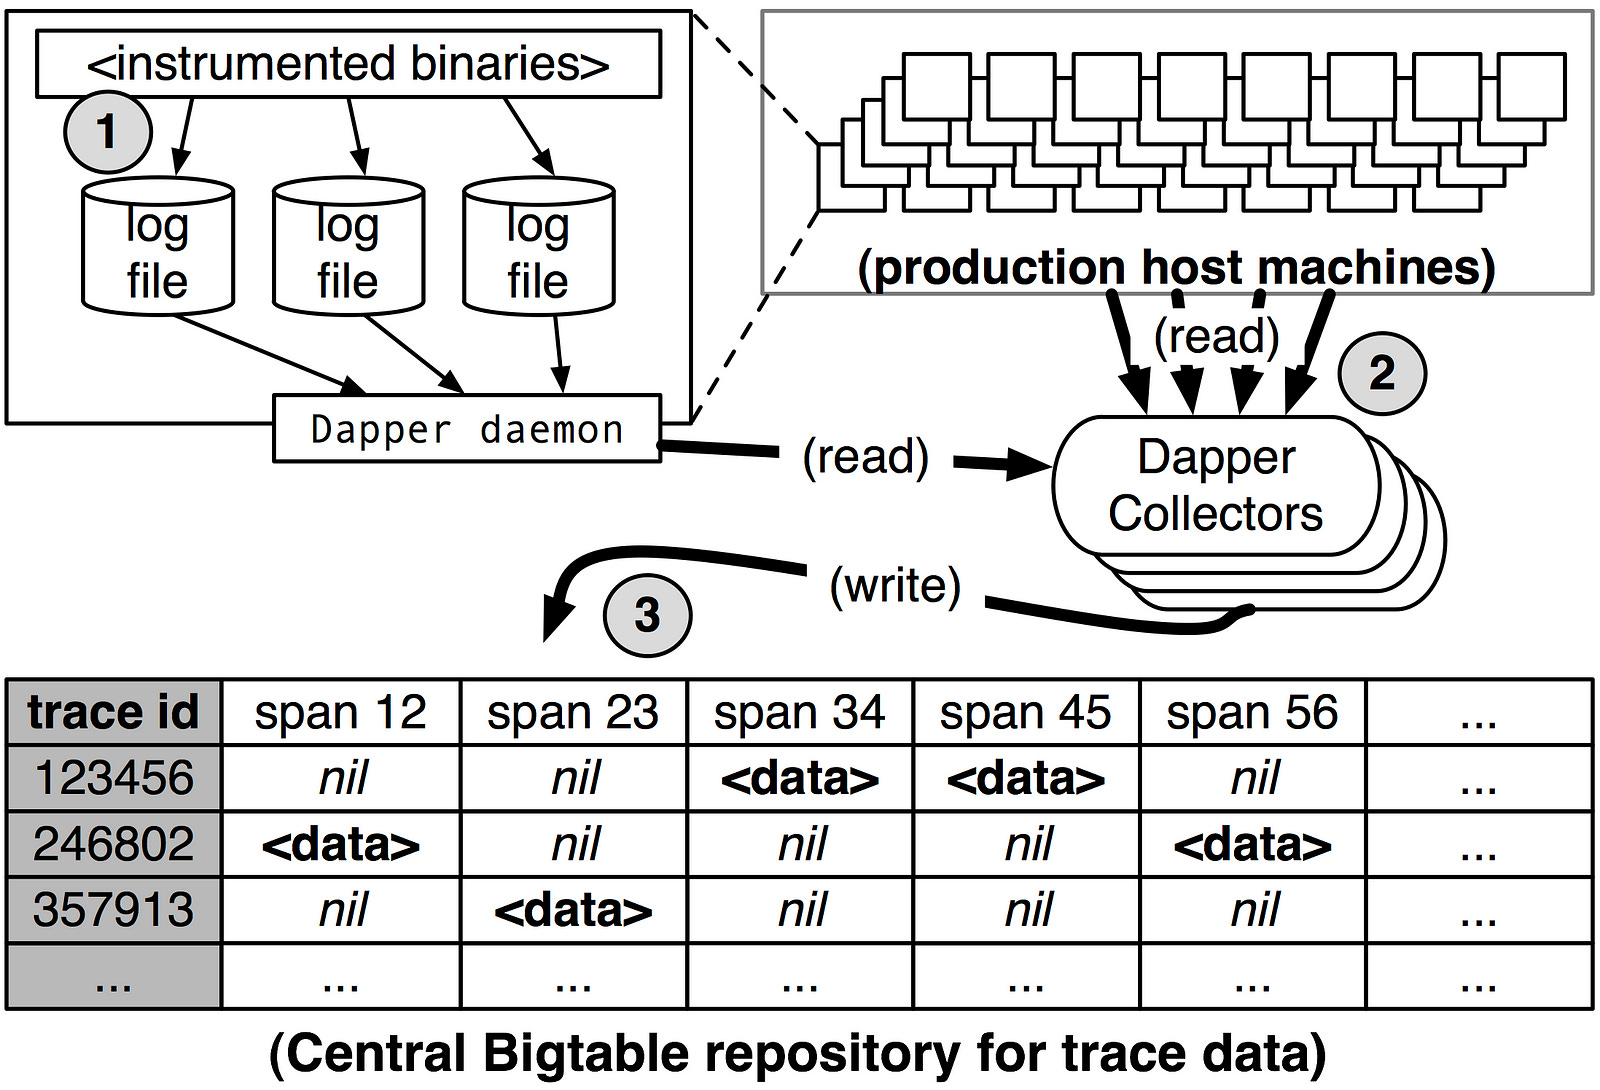
Span data is written to local log files
It is then pulled from all production hosts by Dapper Daemons and collection infrastructure.
Finally written to a cell in one of several regional Dapper Bigtable repositories.
A trace is laid out as a single Bigtable row, with each column corresponding to a span.
The median latency for trace data collection — that is, the time it takes data to propagate from instrumented application binaries to the
central repository — is less than 15 seconds.
Dapper also provides an API to simplify access to the trace data in the Bigtable repository. Developers at Google use this API to build both general-purpose and application-specific analysis tools.
Out-of-band trace collection
The Dapper system performs trace logging and collection of out-of-band with the request tree itself. This is done for two reasons.
First, An in-band collection scheme can affect application network
dynamics. It is not uncommon to find traces with thousands of spans.
In cases like these, the in-band Dapper trace data would be more than application data.Secondly, in-band collection schemes assume that all RPCs are perfectly
nested. The team found that many middleware systems return a result to their caller before all of their backends have returned a final result.
Security and privacy considerations
Dapper stores the name of RPC methods but does not log any payload data now. Instead, application-level annotations provide a convenient opt-in mechanism.
By tracing public security protocol parameters, Dapper is used for monitoring whether applications are satisfying security policies through proper levels of authentication or encryption.
Dapper Deployment Status
Dapper runtime library
The most critical part of Dapper’s code base is the instrumentation of basic RPC, threading, and control flow libraries. This includes code for span creation, sampling, and logging to local disks.
The core instrumentation is less than 1000 lines of code in C++ and under 800 lines in Java. The implementation of key-value annotations adds
an additional 500 lines of code.
Production Coverage
Dapper penetration can be assessed in two dimensions:
The fraction of production processes that can generate
Dapper tracesThe fraction of production machines running Dapper’s trace collection daemon.
Dapper’s daemon is present in the basic machine image so virtually every server at Google has it. And considering ubiquitous Dapper-instrumented libraries, nearly every Google production process supports tracing.
Dapper provides a simple library to help developers control trace propagation manually.
A very small number of programs also use uninstrumented communication libraries and therefore do not support Dapper tracing.
Dapper tracing can be turned off as a production safety measure.
Use of trace annotations
Programmers use application-specific annotations as a distributed debug log file or to classify traces by some application-specific feature.
The dapper team notices Java developers who have adopted the annotation API have made more annotations per span than their C++ counterparts.
Managing Tracing Overhead
The cost of a tracing system is felt as performance degradation. It is because of generation and collection overheads and the number of resources needed to store and analyze trace data.
Trace generation overhead
Trace generation overhead is the most critical segment of Dapper’s performance footprint.
The most important sources of trace generation overhead in the Dapper runtime libraries are creating and destroying spans and annotations and logging them to the local disks for subsequent collection.
Root span creation and destruction takes 204 nanoseconds on average, while the same operation for non-root spans takes 176 nanoseconds.
The cost of additional span annotations is almost negligible. It averages about 9 nanoseconds. If it is sampled, it costs 40 nanoseconds on average.
Writes to local disk are the most expensive operation in Dapper’s runtime library. But their visible overhead is much reduced as they are executed asynchronously with respect to the traced application.
Trace collection overhead
Reading out local trace data can also interfere with monitoring the foreground workload.
The diagram below shows the worst-case CPU usage of the Dapper daemon process based on an unrealistically heavy load testing benchmark.

Dapper also restricts the daemon to the lowest possible priority in the kernel scheduler. Dapper is also a light consumer of network resources,
with each span in our repository corresponding to only 426 bytes on average.
Effect on production workloads
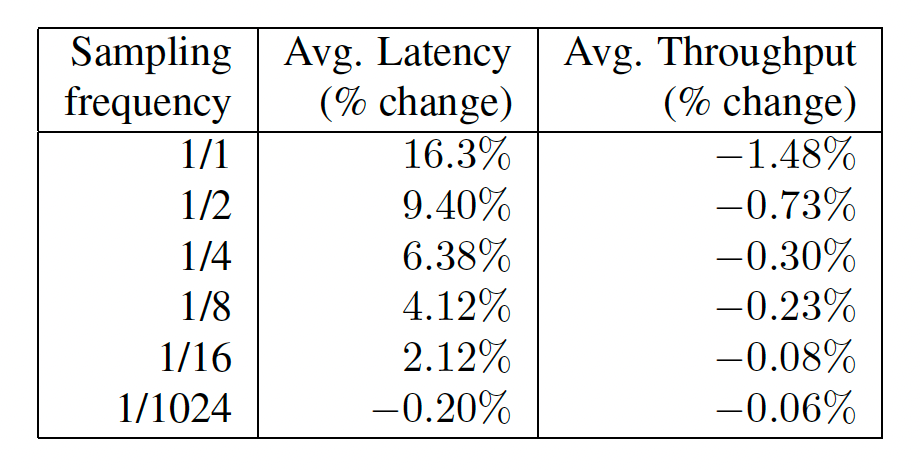
High-throughput online services that use many machines per request are the most demanding to trace efficiently. These services tend to generate the largest volume of tracing data.
The diagram below shows the performance impact of Dapper on average latency and throughput.
Adaptive sampling
The Dapper overhead attributed to any given process is proportional to the number of traces that process samples per unit of time.
The team is deploying an adaptive sampling scheme that is parameterized not by a uniform sampling probability but by a desired rate of sampled traces per unit of time.
Coping with aggressive sampling
New Dapper users often wonder if low sampling probabilities will interfere with their analyses.
The Dapper team believes that, for high-throughput services, aggressive sampling does not hinder the most important analyses.
Additional sampling during the collection
The Dapper team must also control the total data size written to its central repositories. So the team does a second round of sampling for that purpose.
Google production clusters generate more than one terabyte of sampled trace data daily. Sampling a high fraction of requests also brings the Dapper collectors uncomfortably close to the write throughput limit for the Dapper Bigtable repository.
General-Purpose Dapper Tools
The Dapper Depot API
The Dapper “Depot API,” or DAPI, provides direct access to the distributed trace records in the regional Dapper repositories.
Dapper use cases suggested the following three ways to access trace data:
Access by trace id — Load trace by globally unique trace id
Bulk access — The DAPI can leverage MapReduce to provide
parallel access to billions of Dapper traces.Indexed access— The index maps from commonly requested
trace features to distinct dapper traces.
All three access patterns lead the user to distinct Dapper trace records.
Dapper traces are modeled as trees of trace spans. The spans often correspond to RPC calls. Timestamped application annotations are also accessible via the span structures.
Dapper also has a custom index that combines one index for host machines and one for service names. It allows for efficient lookup by service name, host machine, and timestamp in that order.
The Dapper user interface

The Dapper provides an interactive web-based user interface. Let’s learn it at a very high level.
The user describes the service, time window, node information, and cost metric.
A large table of performance summaries for all distributed execution patterns associated with the given service appears.
Once a single distributed execution pattern is selected in the previous step, the user is presented with a graphical depiction of said execution pattern.
After creating buckets that correspond to subdivisions of the cost metric space selected in step #1, the Dapper user interface presents a simple frequency histogram over that metric space. The user is also presented with a list of specific example traces which fall into different ranges of the histogram.
Dapper users see detailed information on specific traces.
Experiences
Using Dapper during development
The Google AdWords team uses Dapper for adherence to service policy terms when new keywords or advertisements are inserted or modified.
Dapper helped them improve their service for performance, correctness, understanding, and testing.
Integration with exception monitoring
Google maintains a service that continually collects and centralizes exception reports from running processes. If these exceptions occurred in the context of a sampled Dapper trace, the appropriate trace and span ids
are included as metadata in the exception report.
Addressing long tail latency
Debugging services like universal search is a very challenging task in Google. An engineer working on long-tail latency debugging built a small library that infers hierarchical critical paths from DAPI Trace objects.
This work with Dapper led to the following discoveries:
Momentary degradation in network performance along the critical path does not affect system throughput but can profoundly affect outlier latency.
Many problematic and expensive query patterns resulted from unintended interactions between services.
Common queries were harvested from a secure logs repository outside Dapper and joined with the Dapper repositories using Dapper’s unique trace ids.
Inferring service dependencies
At Google. It is not possible to infer all inter-service dependencies through configuration information alone. Google’s “Service Dependencies” project has used trace annotations and the DAPI MapReduce interface to automate service dependency determination.
Network usage of different services
Google was able to leverage the Dapper platform to build a continuously-updating console showing the most active application-level endpoints for inter-cluster network traffic. Furthermore, using Dapper, they can
point to the causal trace root for these expensive network requests rather than restricting ourselves to the two peer machines in isolation.
Layered and Shared Storage Systems
Google systems are composed of multiple independently complex layers of distributed infrastructure. In such layered systems, determining end-user resource consumption patterns can be challenging.
Dapper can group and aggregate trace performance information across the various clients of any shared service. This makes it easy for shared service owners to rank their users in terms of various metrics.
Firefighting with Dapper
Dapper is useful for some firefighting tasks. Typically, Dapper users who are firefighting need access to fresh data and need more time to write new DAPI code or wait for periodic reports to run.
For services that are experiencing high latencies or, worse still, timing out given a normal workload, the Dapper user interface can often isolate the location of the latency bottleneck.
By communicating directly with the Dapper daemons, fresh data about specific high-latency traces can be easily gathered.
Other Lessons Learned
Dapper’s broad usage within Google has provided valuable feedback on some of its limitations. A few of them are listed below:
Coalescing effects — In some cases, it is more efficient to buffer a few requests before simultaneously operating on a group of requests. In such instances, a traced request can be blamed for a deceptively large unit of work.
Tracing batch workloads — Dapper’s design was targeted at online serving systems. But offline data-intensive workloads, such as those that fit the MapReduce model, can also benefit from better performance insight.
Finding a root cause — Dapper is not always sufficient for finding the root causes. Programs can use application-level annotations to relay more necessary information to the tracing system, which can help find a root cause.
Logging kernel-level information — The team is investigating a possible
the solution, in which they take snapshots of a few kernel-level activity parameters from the user level and associate them with an active span.
Related Work
Dapper is related to black-box monitoring systems, such as Project5, WAP5, and the Sherlock system. The disadvantage of black-box schemes is some imprecision and larger overheads involved in the statistical inference of causal paths.
Pip and Webmon are examples of systems that rely more heavily on application-level annotations, while XTrace, Pinpoint, and Magpie mostly focus on library and middleware modifications.
Conclusions
Google is using Dapper in production as the distributed systems tracing platform. They have shared their experience of developing and using it.
Dapper is deployed across virtually all of Google’s systems and has allowed the vast majority of our largest workload to be traced.
The best part is that it is done without application-level modifications and with no noticeable performance impact.
By opening Dapper’s trace repositories to internal developers, the team has enabled the creation of many more analysis tools than they alone could have produced in isolation.
References
Pinpoint:http://roc.cs.berkeley.edu/papers/roc-pinpoint-ipds.pdf
X-Trace: https://www.usenix.org/legacy/event/nsdi07/tech/full_papers/fonseca/fonseca.pdf
Pip:https://www.usenix.org/legacy/event/nsdi06/tech/full_papers/reynolds/reynolds.pdf
Project5: https://pdos.csail.mit.edu/~athicha/papers/blackboxes:sosp03.pdf
Sherlock System: https://dl.acm.org/doi/pdf/10.1145/1282380.1282383