
Insights from paper (part I) - Druid: A Real-time Analytical Data Store

Druid is an open-source data store for real-time analytics on large data sets. It provides exploratory analytics of billion-row tables with sub-second latencies. Druid is a distributed system that combines column-oriented storage with an advanced indexing structure.
Introduction
Google introduced MapReduce for leveraging commodity hardware to index extensive data. The original Map Reduce paper inspires Hadoop. Hadoop is currently deployed in many organizations to store and analyze large amounts of log data.
Hadoop excels at storing and providing access to large amounts of data; however, it does not make any performance guarantees about how quickly that data can be accessed. Also, Hadoop’s performance degrades under heavy concurrent load. And one more thing, Hadoop is not optimized for ingesting large amounts of data and making that data immediately consumable.
By now, we understand the pros and cons of Hadoop.
The team at Metamarkets faced challenges with Hadoop, so they explored different RDBMS and NoSQL architectures solutions. Nothing in the open-source world could be fully leveraged for their requirements, so they ended up creating Druid.
Druid shares similarities with other OLAP systems (like IBM Cognos, Oracle Essbase, Oracle OLAP, Applied Microsoft Analysis Services 2005), interactive query systems (like Dremel), main-memory databases (like SAP HANA) and distributed data stores (like Bigtable, Dynamo, and Cassandra).
Druid also borrows ideas from current-generation search infrastructure (like Apache Solr, ElasticSearch, and LinkedIn Senseidb).
This paper describes the architecture of Druid and also explores the various design decisions made in creating an always-on production system.
Problem Definition
Druid was designed to solve problems around ingesting and exploring large quantities of transactional events (like log data).
An example of this type of data can be edits of a page in Wikipedia. See the below table to get a sense of it.

Sample Druid data
Each time a user edits a page in Wikipedia, an event is generated that contains metadata about the edit.
The goal is to compute drill-downs and aggregates over this data rapidly. An example can be “How many edits were made on the page Justin Bieber from males in San Francisco?”
The challenge was that the RDBMS and NoSQL systems of that time could not provide a low-latency data ingestion and query platform for interactive applications. If you are curious about the interactive applications I am talking about, read this blog: Introducing Druid: Real-Time Analytics at a Billion Rows Per Second.
In addition to the query latency needs, the system had to be multi-tenant and highly available.
One more challenge was to allow users and alerting systems to be able to make business decisions in “real-time.”
Druid was open-sourced in October 2012. It has been deployed as a video, network monitoring, operations monitoring, and online advertising analytics platform at multiple companies.
Architecture
A Druid cluster consists of the following four different types of nodes:
Real-time Nodes, Historical Nodes, Broker Nodes, and Coordinator Nodes
Each node type is designed to perform a specific set of things. There is minimal interaction among them. The data composition and flow in a Druid cluster are shown in the figure below.
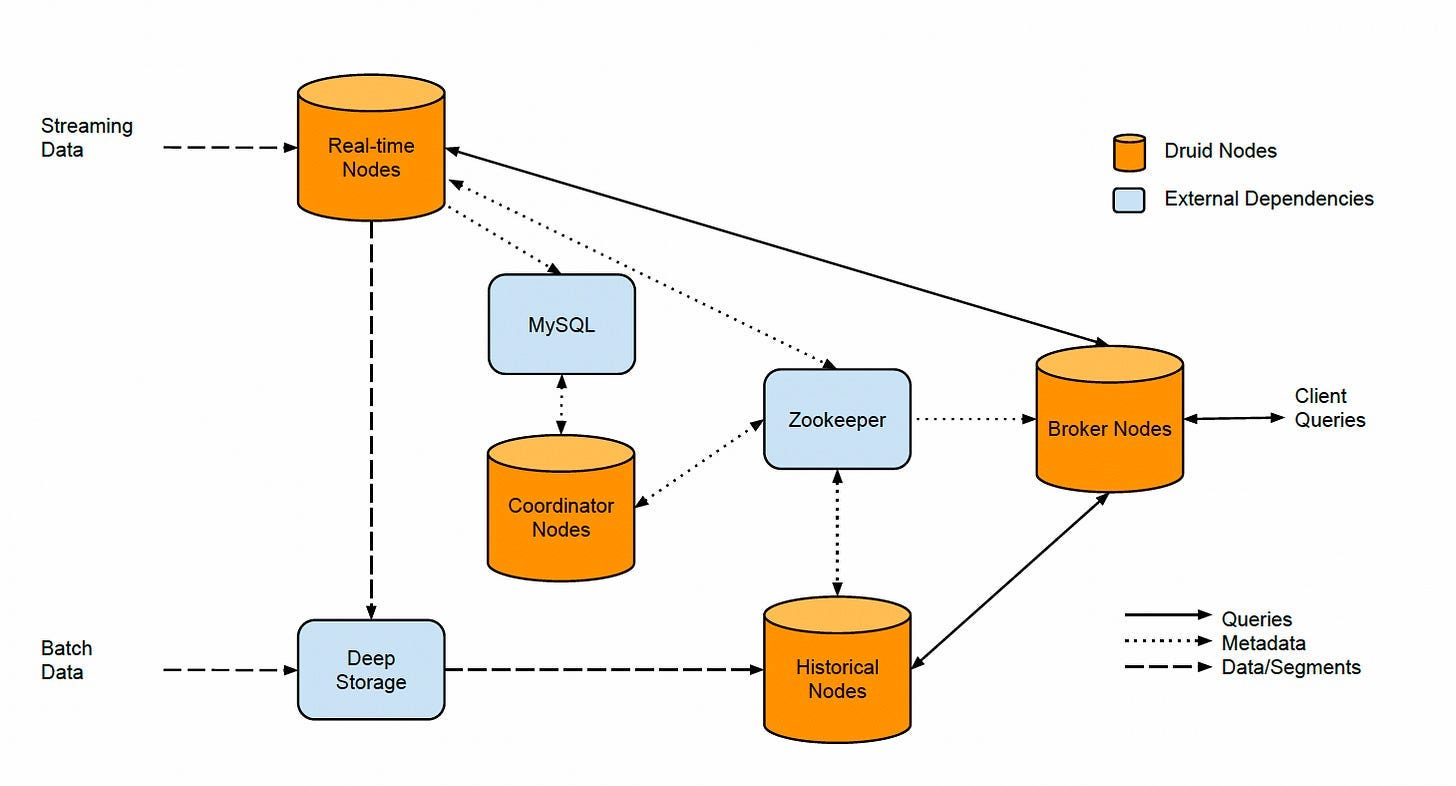
An overview of a Druid cluster and the flow of data
Real-time Nodes
Real-time nodes are designed to ingest and query event streams. Events indexed via these nodes are immediately available for querying.
Real-time nodes leverage Zookeeper for coordination with the rest of the Druid cluster.
Real-time nodes maintain an in-memory index buffer for all incoming events. The indexes are directly queryable.
Druid stores events as rows in JVM heap-based buffer. To avoid heap overflow problems, real-time nodes persist their in-memory indexes to disk periodically or after some maximum row limit is reached.
One important point to note here, the persist process converts this row-oriented data to a column-oriented storage format. We will discuss this format later.
Each persisted index is immutable, and real-time nodes load persisted indexes into off-heap memory. How is it mixed with the in-memory buffer heap for querying? Let’s understand that.
Periodically, each real-time node will schedule a background task. This task searches for all locally persisted indexes, merges these indexes together, and builds an immutable block of data for some span of time. This block is called a segment.

Real-time nodes’ data flow — ingest, persist, load, merge, and hand off.
During the handoff stage, this segment is persisted to permanent backup storage like S3 or HDFS. Druid refers to this storage as deep storage.
The diagram below shows a typical flow of data and events on a real-time node.
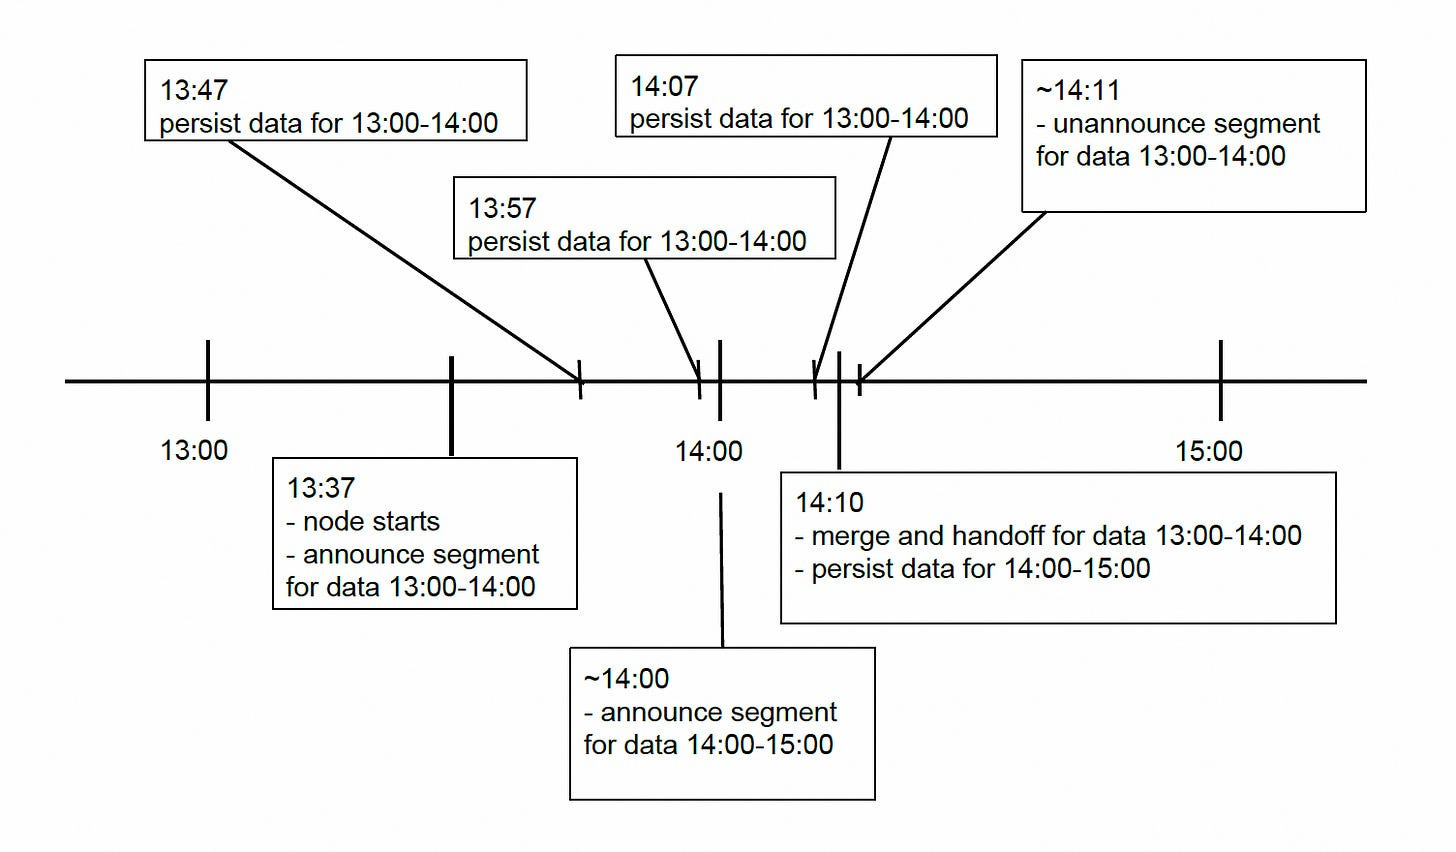
The flow of events is listed below to grasp it quickly.
When events are ingested, the node announces that it serves a data segment for a given interval.
Every 10 minutes (the persist period is configurable), the node will flush and persist its in-memory buffer to disk.
Near the end of the hour, the node prepares to serve data for the next hour and creates a new in-memory index.
The node then announces that it also serves a segment for the next hour.
Node waits for a configurable window period.
At the end of the window period, the node merges all persisted indexes for the last hour into a single immutable segment and hands the segment off.
This segment will be loaded and will be made queryable somewhere else in the Druid cluster.
The real-time node flushes all information about this data and unannounces it is serving this data.
A message bus (Kafka) exists between the producer and the real-time nodes, as shown in the diagram below.
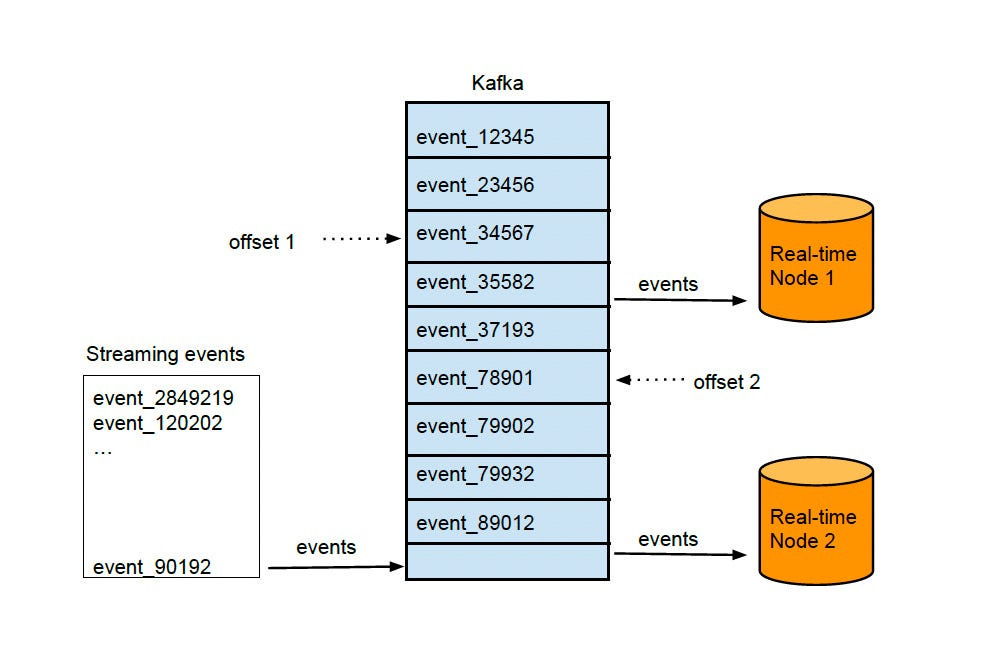
Multiple real-time nodes can read from the same message bus. Each node maintains its own offset.
There are two benefits of the message bus. It maintains positional offsets indicating how far a consumer (a real-time node) has read in an event stream. And the message bus acts as a single endpoint from which multiple real-time nodes can read events.
Historical Nodes
Historical nodes are designed to load and serve the immutable data blocks (segments) created by real-time nodes.
Historical nodes follow a shared-nothing architecture, and no single point of contention exists among the nodes. The nodes do not know of one another. They only know how to load, drop, and serve immutable segments.
Historical nodes announce their online state and the data they are serving in Zookeeper.
Instructions to load and drop segments are sent to Zookeeper and contain information about where the segment is located in deep storage and how to decompress and process the segment.
The historical node first checks a local cache that maintains information about what segments already exist on the node. Once processing is complete, the segment is announced in Zookeeper.

Historical nodes download immutable segments from deep storage. Segments must be loaded in memory before they can be queried.
Historical nodes depend on Zookeeper for segment load and unload instructions. Even if Zookeeper is unavailable, historical nodes can still respond to query requests for the data they serve.
Broker Nodes
Broker nodes are designed to act as query routers to historical and real-time nodes.
Broker nodes understand the metadata published in Zookeeper about what segments are queryable and where those segments are located.
Broker nodes contain a cache that can use local heap memory or an external distributed key/value store. The cache uses the LRU invalidation strategy.
The broker node does three things:
It first maps the query to a set of segments. Results for specific segments may already exist in the cache.
If the cache doesn’t have the required data, It routes incoming queries such that the queries hit the right historical or real-time nodes.
It merges partial results from historical and real-time nodes before returning the consolidated result to the caller.

Broker Nodes
If broker nodes cannot communicate with Zookeeper, they use their last known view of the cluster and continue to forward queries to real-time and historical nodes.
Coordinator Nodes
Coordinator nodes are designed for data management and distribution on historical nodes. The coordinator nodes tell historical nodes:
Load new data
Drop outdated data
Replicate data
Move data to load balance
Druid uses a MVCC (multi-version concurrency control) swapping protocol for managing immutable segments.
Coordinator nodes undergo a leader-election process determining a single node that runs the coordinator functionality. The remaining coordinator nodes act as redundant backups.
A coordinator node runs periodically to determine the current state of the cluster. Coordinator nodes maintain a Zookeeper connection for current cluster information.
Coordinator nodes also maintain a connection to a MySQL database that contains additional operational parameters and configurations.
MySQL database has a table that contains a list of all segments that historical nodes should serve. This table can be updated by any service that creates segments.
This database also contains a rule table that governs how segments are created, destroyed, and replicated in the cluster.
Typically, queries hit dozens or even hundreds of segments. Determining optimal load distribution requires some knowledge about query patterns and speeds. The team developed a cost-based optimization procedure considering the segment data source, recency, and size.
The number of replicates in each tier of the historical compute cluster is fully configurable.
If Zookeeper becomes unavailable, the coordinator can no longer send instructions to assign, balance, and drop segments. However, these operations do not affect data availability at all.
I will cover the rest of the paper in the second part of the post, so stay tuned!
References:
Original Paper : http://static.druid.io/docs/druid.pdf