
Insights from paper (part II) - Druid: A Real-time Analytical Data Store

In the first part of the article, I have covered the introduction and architecture of Druid paper. I will cover the rest of the paper in this part. Please go through the first part to understand this part in a better way if you are not done already.
Storage Format
Data tables in Druid (called data sources) are collections of timestamped events partitioned into a set of segments, where each segment is typically 5–10 million rows.
A segment is a collection of rows of data spanning some time. Segments are the fundamental storage unit in Druid. Replication and distribution are done at a segment level.
Druid partitions its data sources into well-defined time intervals. It usually is an hour or a day. It may be further partitioned using other columns to achieve the desired segment size.
Segments are uniquely identified by a data source identifier, the time interval of the data, and a version string that increases whenever a new segment is created.
The version string indicates the freshness of segment data.
Druid segments are stored in a column orientation. Druid has multiple column types to represent various data formats. Different compression methods are used to reduce the cost of storing a column.
Let’s take an example of string columns. Storing strings directly is unnecessarily costly. String columns can be dictionary encoded. It is a standard method to compress data. For example, the page column in the previous post looks like below:

We can map each page to a unique integer identifier. Here we can encode like below:
Justin Bieber -> 0 and Ke$ha -> 1
Now the page column can be represented as an integer array where the array indices correspond to the rows of the original data set. So we can represent the above data set with the below array:
[0, 0, 1, 1]
On top of these encodings, any generic compression algorithms can be run. Druid uses the LZF.
Indices for Filtering Data
Let’s take an example of the query, “How many Wikipedia edits were done by users in San Francisco who are also male?”
This query filters the Wikipedia data set based on a Boolean expression of dimension values.
Druid creates additional lookup indices for string columns such that only those rows that pertain to a particular query filter are ever scanned.
Let’s continue with our previous string column page example. For each unique page, we can form some representation indicating which table rows a particular page is seen.
We can store this information in a binary array where the array indices represent our rows. If a page is in a certain row, that array index is marked as 1.
See the example below and note that the binary array is indexed left to right. The first two indexes 0 and 1, are marked 1 for Justin Bieber as [1][1][0][0]
Justin Bieber -> rows [0, 1] -> [1][1][0][0]
Ke$ha -> rows [2, 3] -> [0][0][1][1]
Now if we want to know which rows contain Justin Bieber or Ke$ha, we can OR together the two arrays.
[1][1][0][0] OR [0][0][1][1] = [1][1][1][1]
These binary arrays are called inverted indexes. These perform Boolean operations on large bitmap sets like search engines.
Druid uses the Concise algorithm on top of Bitmap indices for OLAP workloads.
Storage Engine
Druid’s persistence components have pluggable architecture. These storage engines may store data in an entirely in-memory structure, such as the JVM heap or any memory-mapped structure.
By default, a memory-mapped storage engine is used.
Druid relies on the operating system to page segments in and out of memory. The main drawback of using the memory-mapped storage engine is when a query requires more segments to be paged into memory than a given node has the capacity for. In this case, query performance will suffer from the cost of paging segments in and out of memory.
Query API
Druid has its own query language.
Druid accepts queries as HTTP POST requests. The body of the POST request is a JSON object containing key-value pairs specifying various query parameters.
The result will also be a JSON object containing the aggregated metrics over time.
Most query types will also support a filter set. A filter set is a Boolean expression of dimension names and value pairs.
A sample count query over a week of data is as follows:
{
"queryType" : "timeseries",
"dataSource" : "wikipedia",
"intervals" : "2013-01-01/2013-01-08",
"filter" : {
    "type" : "selector",
    "dimension" : "page",
    "value" : "Ke$ha"
},
"granularity" : "day",
"aggregations" : [{"type":"count", "name":"rows"}]
}
The above query will return a count of the number of rows in the wikipedia data source from 2013–01–01 to 2013–01–08, filtered for only those rows where the value of the “page” dimension is equal to “Ke$ha”. The results will be bucketed by day and will be a JSON array of the following form:
[ {
"timestamp": "2012-01-01T00:00:00.000Z",
"result": {"rows":393298}
},
{
"timestamp": "2012-01-02T00:00:00.000Z",
"result": {"rows":382932}
},
...
{
"timestamp": "2012-01-07T00:00:00.000Z",
"result": {"rows": 1337}
} ]
At the time of paper writing, a join query for Druid was not implemented.
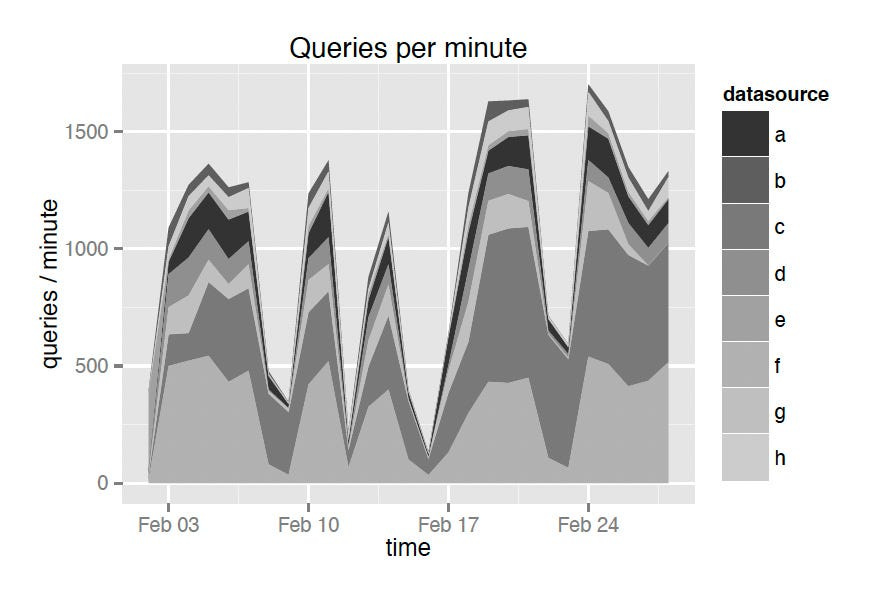
Performance
Query Performance in Production
Druid query performance can vary significantly depending on the query being issued.
To showcase the average query latencies in a production Druid cluster, the team selected 8 of their most queried data sources given below:

Approximately 30% of queries are standard aggregates involving different metrics and filters, 60% of queries are ordered group bys over one or more dimensions with aggregates, and 10% are search queries and metadata retrieval queries.
There are some essential points about the results:
The results are from a “hot” tier in our production cluster.
There were approximately 50 data sources in the tier.
Approximately 10.5TB of RAM was available in the “hot” tier and approximately 10TB of segments were loaded.
There are about 50 billion Druid rows in the “hot” tier.
The hot tier uses Intel® Xeon® E5–2670 processors, consisting of 1302 processing threads and 672 total cores (hyperthreaded).
The below two diagram shows the results of experiment.
Query latency diagrams:

Queries per minute diagram:
Druid has posted the query Benchmarks on TPC-H Data, but I am omitting those. Interested readers can see them on paper. Those are only facts and figures.
Druid in Production
Druid is often used to explore data and generate reports on data. Exploratory queries often involve progressively adding filters for the same time range to narrow down results. Users tend to explore short time intervals of recent data.
Queries for large data sources may end up hitting every historical node in a cluster and consume all cluster resources. Smaller, cheaper queries may be blocked from executing in such cases. The team introduced query prioritization to address these issues.
If historical nodes fail and do not recover, their segments must be reassigned, which means we need excess cluster capacity to load this data. It is extremely rare to see more than two nodes fail simultaneously. So Leaving enough capacity in the cluster to reassign the data from 2 historical nodes entirely is good.
Each Druid node is designed to emit a set of operational metrics periodically. The team used to load them into a dedicated metrics Druid cluster.
Druid can be paired with a stream processor such as Apache Storm. The Storm topology forwards the processed event stream to Druid in real-time. Storm handles the streaming data processing work, and Druid is used for responding to queries for both real-time and historical data.
The tier configuration in Druid coordinator nodes allows for segments to be replicated across multiple tiers. So segments can be exactly replicated across historical nodes in multiple data centers.
Related Work
Druid, feature-wise, sits somewhere between Google’s Dremel and PowerDrill. Druid has most of the features implemented in Dremel.
If you are interested in knowing more about Google’s Dremel. Read my post here: https://medium.com/@hemantkgupta/insights-from-paper-google-dremel-interactive-analysis-of-webscale-datasets-b9466d77bfa1
Druid has native analytical features baked in, similar to ParAccel.
Druid is similar to C-Store and LazyBase in that it has two subsystems, a read-optimized subsystem in the historical nodes and a write-optimized subsystem in real-time nodes.
Druid’s low latency data ingestion features are similar to Trident/Storm and Spark Streaming (D-Stream). However, both systems are focused on stream processing, whereas Druid is focused on ingestion and aggregation.
Stream processors are great complements to Druid.
Conclusions
Druid is a distributed, column-oriented, real-time analytical data store. It is designed to power high-performance applications and is optimized for low query latencies. Druid supports streaming data ingestion and is fault-tolerant.
References:
Original Druid Paper: http://static.druid.io/docs/druid.pdf
Part I of the article: https://www.hemantkgupta.com/p/insights-from-paper-part-i-druid
Dremel: interactive analysis of web-scale datasets: S. Melnik, A. Gubarev, J. J. Long, G. Romer, S. Shivakumar, M. Tolton, and T. Vassilakis. Proceedings of the VLDB Endowment, 3(1–2):330–339, 2010.
Paraccel analytic database: http://www.paraccel.com/resources/Datasheets/ ParAccel-Core-Analytic-Database.pdf, March 2013.
C-store: a column-oriented dbms: M. Stonebraker, D. J. Abadi, A. Batkin, X. Chen, M. Cherniack, M. Ferreira, E. Lau, A. Lin, S. Madden, E. O’Neil, et al. In Proceedings of the 31st international conference on Very large data bases, pages 553–564. VLDB Endowment, 2005.
Lazybase: trading freshness for performance in a scalable database: J. Cipar, G. Ganger, K. Keeton, C. B. Morrey III, C. A. Soules, and A. Veitch. In Proceedings of the 7th ACM european conference on Computer Systems, pages 169–182. ACM, 2012.
Storm: Distributed and fault-tolerant realtime computation: N. Marz. http://storm-project.net/, February 2013.
Discretized streams: an efficient and fault-tolerant model for stream processing on large clusters: M. Zaharia, T. Das, H. Li, S. Shenker, and I. Stoica. In Proceedings of the 4th USENIX conference on Hot Topics in Cloud Computing, pages 10–10. USENIX Association, 2012
Hello Sir, just wondering if we could compare Druid with Pinot